
Cost-per-Hire: Deep Dive
The Scale Series | Part 5

The 2022 Cost-Per-Hire Guide is the fifth installment in the Scale Series by Betts Recruiting, and here we will take you through a deep dive into one of the most critical challenges to scalability in the startup lifecycle.
In the first Scale Guide, we established the difference in recruiting success between companies who raised their next rounds of funding and those that didn’t. We also dabbled in the importance of Cost-Per-Hire (CPH) when thinking about those hiring plans.
In this guide, we want to establish the conclusive Cost-Per-Hire definition along with taking this conversation much, much deeper. In a study by Betts, 60% of companies surveyed did not know their total CPH or individual Cost-Per-Hire benchmarks.
CPH is also only one part of the recruiting efficiency conversation. You have to look at the other side, specifically Revenue-Per-Hire (RPH) which leads to your actual Cost Per Dollar of ARR. Our goal is to ensure that every finance leader and head of talent acquisition agrees on how to measure the value of their hires along with the costs associated with not making those go-to-market hires on time. We will focus on revenue-generating roles, with examples on CPH for account executive (AE) hiring. For executive and leadership hiring, see our Executive Compensation Guide.
Here are the 6 parts of our scale series:
Overview
The True Cost Per Dollar of ARR
Tech companies have relied on North Star Metrics (NSM) for years as a simple yet decisive reflection of KPIs achieved. These hone in on measurements that sum up performance impact and health to stakeholders quickly, such as users per month on a subscription service. It is an easy way to communicate output without committing to a whole PowerPoint presentation or spreadsheet shuffle.
After dozens of discussions with our clients, Betts has broken down the North Star Metrics most useful for quantifying talent acquisition ROI in SaaS companies. Consolidating total revenue with the Cost-Per-Hire formula enables you to produce a new benchmark which allows you to establish what you need to meet your goals. The result is you will be able to determine how much to spend per candidate for each dollar of annual recurring revenue (ARR), and ensure ROI from their start date. We also break this down by each venture funding series, as the amount paid for your first AE hire looks very different than your 100th AE hire.
Average Recruitment Costs vs Recurring Revenue
Talent acquisition is one of the most expensive parts of human resource management after general employee overhead, but also one of the most important. Attrition rates spiked in 2021 with the Great Resignation, creating one of the hottest job markets in the last 10 years in early 2022, and even as job growth slowed down near the end of 2022 there are still more jobs open in tech than candidates looking and laid off combined. We note this because not only is there a gap in companies understanding their pure costs per each hire, but also understanding the Cost-Per-Hire metric as it relates to the revenue generated. With the tech market squeezed for the right talent, we want to outline a new methodology for looking at CPH.

There are 3 components in looking at the North Stars of talent acquisition:
- First is Cost-Per-Hire, this is the total cost outlined below for making a hire divided by the number of hires.
Cost Per Hire (CPH) = Total Cost ÷ Number of Hires - Second is Revenue-Per-Hire. This is simply the quota of the sales rep times the attainment. For SDR’s, review the pipeline built times the close rates, and for Customer Success review the net retention loss from not having a CSM.
Revenue-Per-Hire (RPH) = Quota x Attainment - Finally we get to the good stuff. This is your Cost Per Dollar of ARR, where you divide your Cost-Per-Hire by your annual revenue to calculate the net gain from your new hire and help establish your budget goal.
Cost Per Dollar of ARR = CPH ÷ ARR
When looking at these North Star Metrics, often the biggest mistake made is not including all of the costs. We’ve seen some clients include only outside resources in their Cost-Per-Hire. It’s vital to remember that if you have internal recruiters, LinkedIn Recruiter, etc., your CPH can’t be 0 - you need to factor these in too. Below we outline almost all the options in looking at CPH. The average Cost-Per-Hire for early stage startups is around $12,000 vs later stage startups where it drops significantly to $6000. The Cost-Per-Hire in tech is 2-5X the national average purely due to the scarcity of talent along with the industry’s ever evolving nature.
Your method(s) of recruitment will also undoubtedly impact the final cost, and needs to be taken into account when calculating how much you are spending per hire. While there are some nominally free options (eg: relying on your personal network or your venture capital investors’), these are not inherently scalable, so you will most likely choose one or more from this mix:
Cost-Per-Hire Formula
What Goes into CPH?


Referral Program A referral program lets you take advantage of your existing network (e.g., current employees) by incentivizing your contacts to recommend qualified candidates with the offer of a bonus if they are hired, which can be cheaper than other options but still requires investment to deploy.
Recruitment Agency Recruitment agencies are a great way to scale hiring and save time internally, but keep in mind that there are fees involved when bringing in a firm - make sure whoever you’re working with gives you the best bang for your buck when it comes to the quality of candidates.
Job Board Indeed, LinkedIn and various other job board platforms grant the benefits of an open marketplace integrated with automated features, but require a lot more time and money than most smaller firms realize until they hit the limit of how far they can scale with these tools.
Internal Recruiters Hiring internal recruiters gives you direct control over candidate engagement, but requires more investments from salary considerations to tools needed to get the job done, and could introduce scalability concerns at key points.


Outsourced Recruiting The recruitment process outsourcing (RPO) model is an alternative to both bringing on an agency or hiring a recruiter internally and can be a great way to scale at the early stages, though obviously it still has limits as far as network reach and quality of sourcing.
Betts Connect - Self-Sourcing Betts Connect is our hiring platform that lets your talent team engage with our network of actively searching candidates. Connect self-sourcing makes any internal talent acquisition team 2X more efficient due to the pre-vetted, active, engaged candidates on the platform. With KPIs like sales cycle, verticals sold into and target compensation information, our clients are able to skip the first round of candidate sourcing.
Betts Connect - Just in Time (JIT) Betts Connect - Just in Time Talent is a product designed for companies without talent acquisition teams or those who need a boost in guaranteed-hiring above what their resources can handle. We’ve built one of the largest networks of tech talent in North America, and due to the success of our matching algorithm we are able to reactivate talent (just in time). By guaranteeing interviews, we’ve created the first product in talent acquisition where you can have a plan to get to your hiring goals.

Cost-Per-Hire Equation and Benchmarks
Target average Cost-Per-Hire for each investment stage:
What is Revenue-Per-Hire
When looking at your go-to-market hiring goals and the spend behind that, it's imperative that you calculate what revenue impact these roles are going to have on your business. If you are looking for an SMB AE vs an Enterprise AE, the revenue impact both short and long term will vary (obviously). Yet in a recent survey, 75% of companies admitted not taking this impact into account. Revenue-Per-Hire is not a difficult calculation, but it's an important one.
Take the quota of the person being hired and multiply that by average attainment. The biggest mistake is not being honest when looking at quota attainment. If this is an early hire, don’t assume they will be hitting over 80%.
Cost-Per-Dollar of ARR
Now here’s where things get exciting..ish. Cost-Per-Hire is only half of the story and Revenue-Per-Hire the other, but when you combine the two you get our North Star for talent acquisition - Cost-Per-Dollar (CPD) of ARR. This is the simplest metric to give you a benchmark of how much to be spending per 1$ of ARR.
Below, we broke down the benchmarks by venture funding Series for talent acquisition leaders and CFO’s alike. These benchmarks were derived from working with hundreds of companies to not only understand their cost-per-hire but also the value each of those hires delivers to a company in that series.
CFO’s and finance leaders have benchmarks for everything BUT hiring GTM talent. You ask them how they got to their CPH goals, it’s often either they don’t have them or they built a model based on experience that lands somewhere between $2000 - $5000 per hire on “average.”
Example: You’re a Series A company, that means your benchmark is 1.5% per $1 of ARR. So that 1.5% is what you are trying to reach to be in the range of best-in-class. So, if you have an AE that’s got a $500K quota and 80% Attainment you take 1.5% x $500,000 x .8 = $6000 per hire.


Cost-Per-Hire - BUDGET
In the below visualization we not only lay out the benchmarks for Cost-Per-Dollar (CPD) of ARR but also The Budget. This is a new concept in which we not only look at the best-in-class benchmarks, but also what the budget should be per hire based on the value of revenue brought in per venture capital funding stage. Simply, this is the max spend at each funding Series (and Seed). You’ll notice that the total budget is 2-3X that of the best-in-class benchmarks, which is important to factor in.
Let's keep the Series A example going. Now, $6000 CPH for a $500k AE is the goal but if you aren’t able to get that person in-seat on time, the revenue loss is going to start to add up. So, the budget is up to 5% to get that hire in-seat ON TIME, i.e., 5% x $500,000 x .8 = $20,000. $20k is the budget you should be setting with your CFO to ensure they get in on time or else that timing miss can affect your revenue attainment. Your goal in talent acquisition is to get this down to the 1.5% range.

Cost-Per-Hire


Time

Start Date
Loss Per Hire (LPH) is defined as the total cost for a hiring miss. This includes both the lost monthly revenue (compounding) + the Cost-Per-Hire.
Loss-Per-Hire
Lost Revenue + Loss-Per-Hire
The inverse of planning for how much revenue a filled position will bring in is measuring how much you stand to lose for however long that role stays open. Simply put, for every month a revenue-generating hire is not in place you are losing revenue and will need to keep spending on search recruiting, therefore not only are you losing revenue but your Cost-Per-Hire is going to skyrocket.

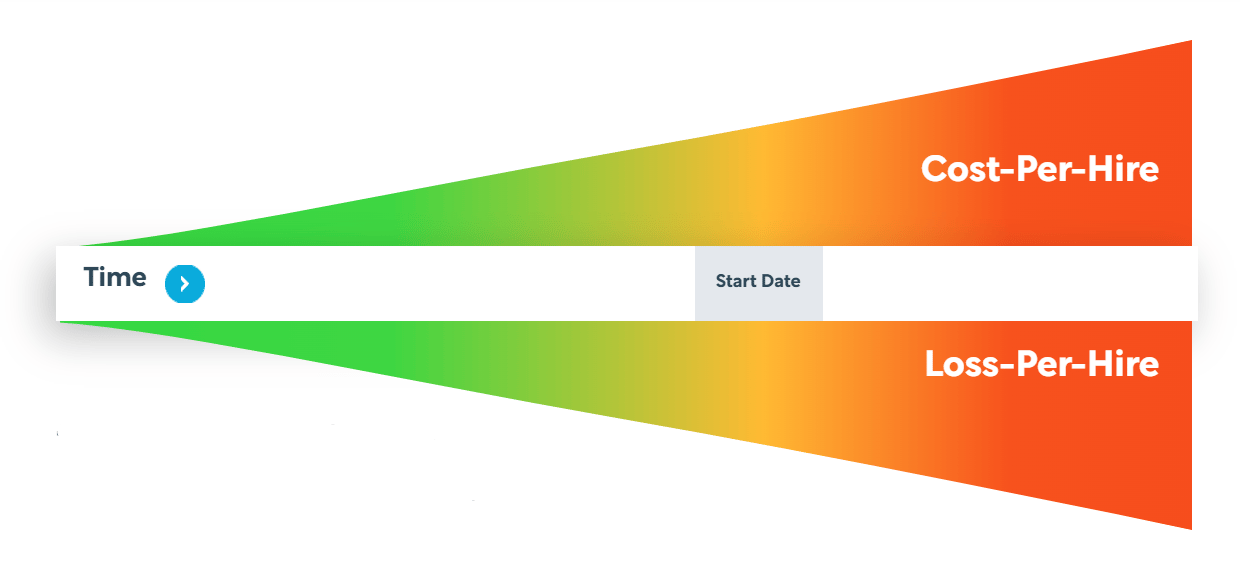
Loss Per Hire (LPH) is defined as the total cost for a hiring miss. This includes both the lost monthly revenue (compounding) + the Cost-Per-Hire.
Hiring Costs from Seed to Series D
As mentioned previously, recruitment expenses vary between each startup Series. While the types and volume of positions that need to be filled are big factors, the maturity and scalability of your talent acquisition process has a significant, if not greater, impact.
Here is a breakdown of what your hiring mix should look like at each stage and how it affects your costs:
Seed and Series A
From Seed to Series A when looking at your hiring forecast you are focusing on finding the right talent, NOT a high volume of talent. But with only 2 years to hit revenue goals between each funding stage, timing is everything.
The below visualization of a hiring forecast lays out the steps we recommend in finding your GTM hires. Start with your personal network and your VC network - they’re Free, but expect to start sourcing 2-3 months before you need the hire in-seat. Then, incentivize your team with a referral program - no question, referrals are the best way to scale at Seed to Series A. If it’s a month out and you still don’t have that hire, though…check out our platform, Betts Connect. With pre-vetted, engaged tech talent at your fingertips this is the closest you can get to a scalable referral program. If the start date comes and goes, your lost revenue clock starts and you can see it compounds quickly.

-$83K
-$50K
-$16K

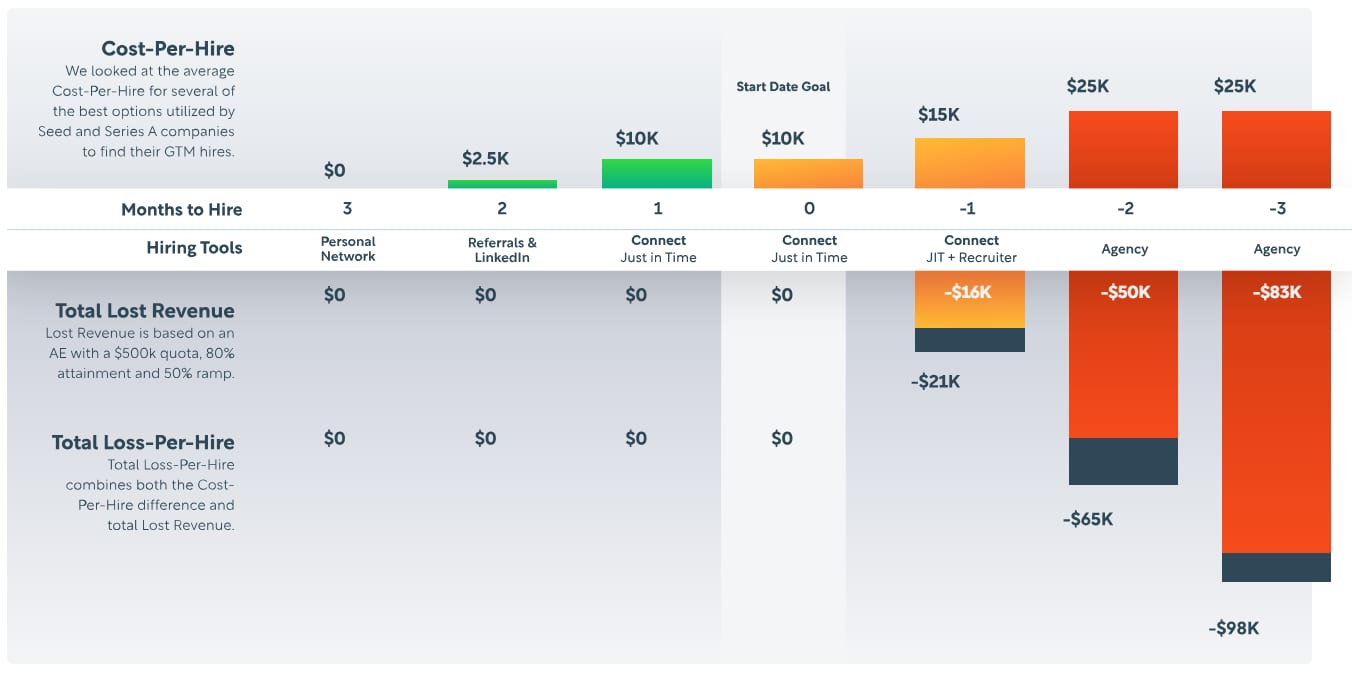

Seed / Series A - Forecasting for Cost-Per-Hire vs Loss-Per-Hire
Assuming 1 AE hire


-$30K
-$30K
-$30K
-$30K

Series B
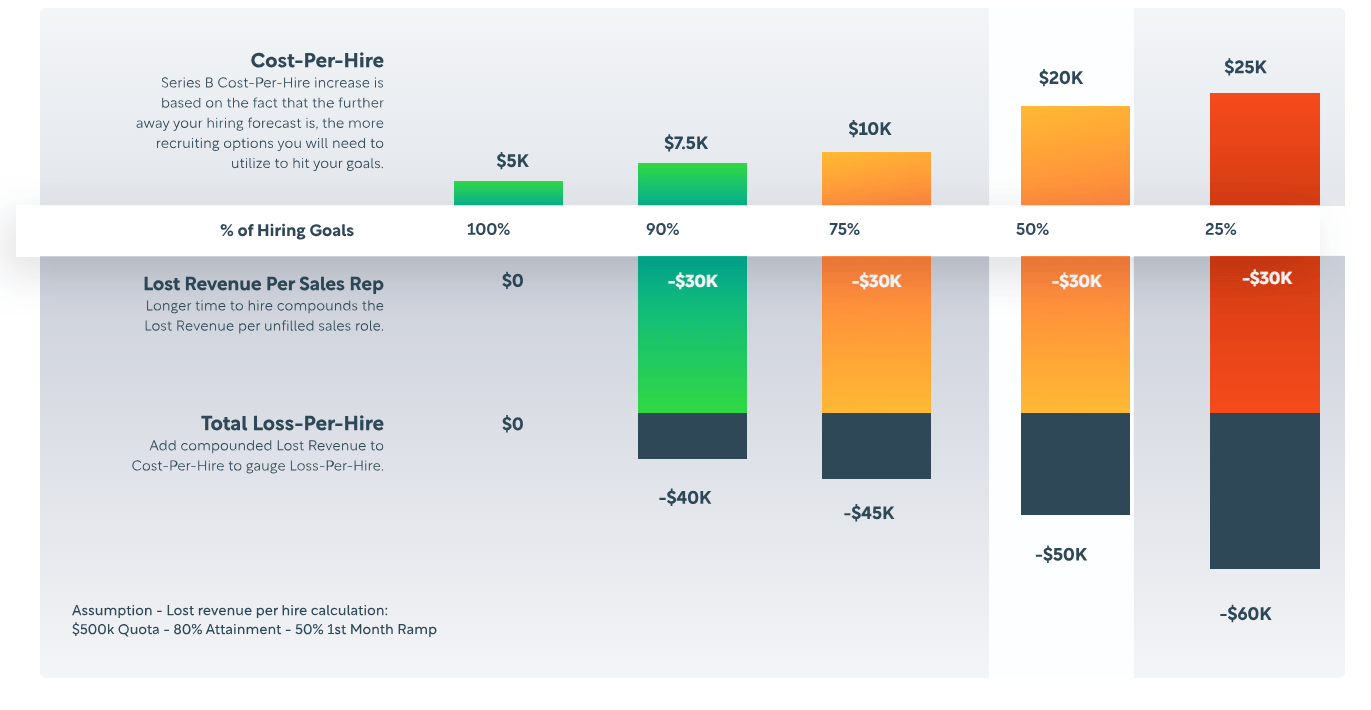
Series B is where you will really see the impact - and challenges - of scaling talent acquisition efficiently, including accurately forecasting Cost-Per-Hire versus Revenue-Per-Hire. The below model is a forecasting tool in which we look at what percentage of hiring goals that your current team - armed with their current tools - can hit over the next 6 months. If you can meet your goals, you are in a GREAT place.
However, the further off your forecast, the higher your costs are going to be to get them in-seat. This means revenue loss is going to be higher too, i.e., if you have 20 hires to make over 6 months with 1 internal recruiter with LinkedIn Recruiter, and let's say you hit 50% of those hires, on average your CPH will be $20,000 and you will have a revenue loss of $30,000, for a total hiring loss of $50,000 per person (you can see this highlighted in the chart below). So for that 10 hire miss, your total loss would be $500,000. This isn’t all encompassing, but using this exercise demonstrates how important forecasting key North Star metrics are in talent acquisition.

Series B - Forecasting for Cost-Per-Hire vs Lost-Per-Hire
Average Cost-Per-Hire with Forecast for next 6 months based on current team, tools, etc.

Series C and Series D
At Series C to Series D+, not having the right team and tech stack in place can have huge impacts on both overhead costs and lost revenue. In the below example, we look at hiring 100 AE’s within a year as well as the overall impact that not having the right resources in place has on your goals and business.
I.e., If you are entering 2023 and have to hire 100 AE’s over the next 12 months and are only able to get 50% of those hires with the current team and tech stack, that means you will have to spend an additional $800,000 for sourcing on average along with a potential loss of $10M for the year. Simply put, hiring at volume takes a lot of planning.


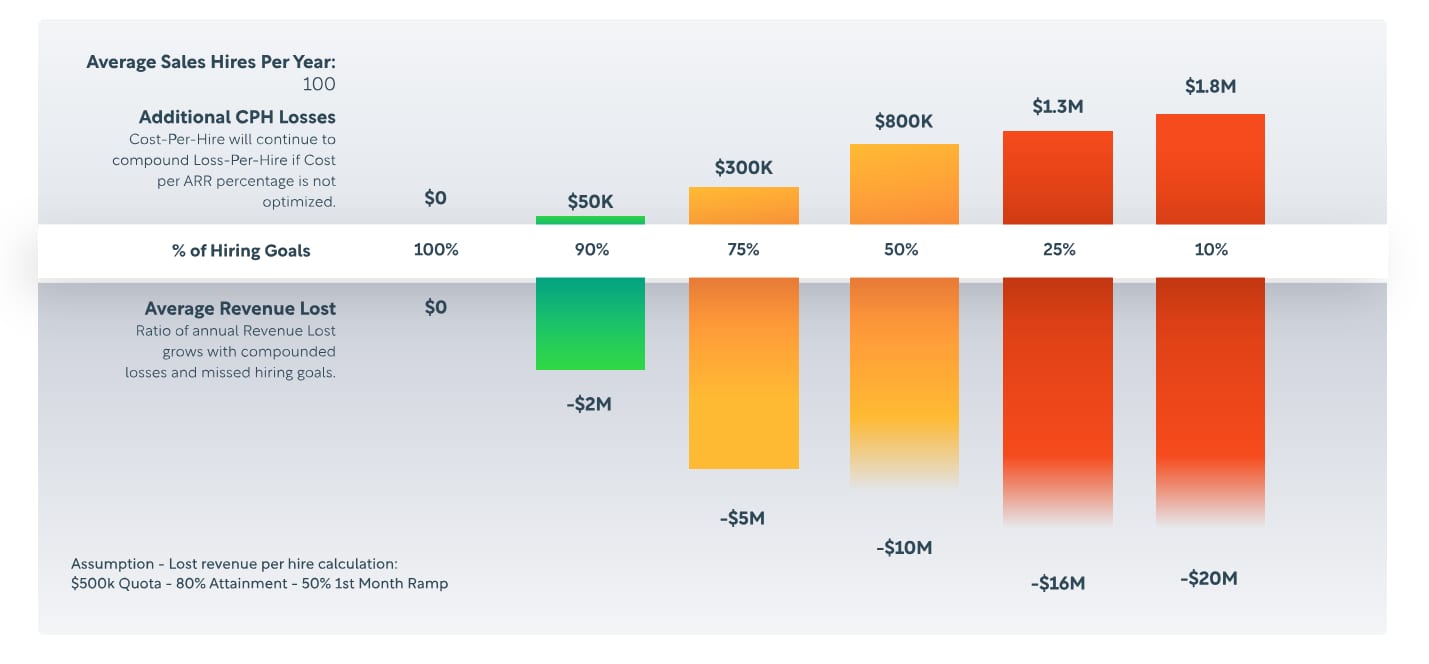
Series C / Series D - Forecasting for Cost-Per-Hire vs Loss-Per-Hire
Average Cost-Per-Hire with Forecast for next 12 months based on current team, tools, etc.


Ensuring your Cost-Per-Hire stays manageable from Seed to IPO is a tricky beast, but Betts Recruiting is here to help you cut through the noise and establish a working formula that puts you on the path to ROI. Let’s look at some of the key takeaways we covered in the Cost-Per-Hire Guide:
Cost-Per-Hire divided by ARR is your North Star KPI for talent acquisition success
- From this you will be able to derive your hiring goal benchmark
- Use the hiring budget goal benchmark for each funding stage to help set your budget for 2023
The longer the time to hire, the greater the compounding cost on your Loss-Per-Hire
- You lose more revenue the longer a position is unfilled and will spend beyond your scaling goal for Cost-Per-Hire
- Correctly forecasting for the time to get a hire in-seat at each stage (from Seed to Series D+) helps you minimize Cost-Per-Dollar of ARR per hire
Key Takeaways
Scaling your organization efficiently with Betts Connect
The key to taking control of your CPH is scalability. Betts Connect is designed to help you successfully scale recruiting at every stage, and reduce total time to hire and Cost-Per-Hire across the board. Discover how Betts Connect and Betts Connect Just in Time equip you to propel your talent acquisition into the future by getting in touch with our team today.
Start Hiring with Betts
